
When machine learning models fail to perform as expected, the natural reaction is to tweak the model architecture and parameters. However, taking a Data-Centric approach by analyzing and improving your training data can be more effective.
In this article, we walk through a real-world task of debugging a dataset for detecting defects in manufacturing casting.
Table of Contents
- A metal casting defects dataset
- A common scenario: “increase the performance, but how?”
- Where is the model being challenged?
- A thorough analysis of the Burr Class
- Where to go from here
1. A metal casting defects dataset
Metal casting is a manufacturing process in which molten metal is poured into a mold cavity and allowed to solidify into a desired shape.
Defects can occur during the metal casting process, such as gas porosity, shrinkage cavities, mold material inclusions, and surface cracks. For quality control, metal castings are inspected for these types of defects using automated vision inspection. Our defect detection dataset [1] focuses on five common flaws found in metal casting: open hole, blow hole, scratch, crack and burr (Figure 1).
Figure 1. A dataset for detecting defects in metal casting
2. A common scenario: “increase the performance, but how?”
As a Machine Learning Engineer, one of your primary tasks is to find ways to improve model performance. Typically, you either (a) start with a pre-trained model that you need to optimize, or (b) are tasked with training a model from scratch.
Regardless of the kind of model you have in your hands, it’s common for certain classes to not perform as well as others. In our case, as shown in Figure 2, our model is particularly adept at two classes, but is failing terribly at the rest: burr (0.35 mAP), crack (0.30 mAP), and scratch (0.33 mAP).

Why you might want to increase performance — on the failing Classes?
The natural answer is that a better model will naturally improve your overall ML system. The hidden answer though, and the one your ML team leader is really interested in is this:
Increasing mAP on failing Classes can expand the potential revenue for your company.
How can we improve performance on these weaker classes? In our Tenyks-Recycleye case study, we describe how developing a vision system capable of detecting edge cases, allowed Recycleye to expand its potential revenue by more than £50 million. This example illustrates how enhancing model performance on critical failure cases can have a huge business impact.
3. Where is the model being challenged?
A Data-Centric approach
The idea behind Data-Centric was first introduced by leading AI researcher and entrepreneur Andrew N.G.:
Data-Centric is “the discipline of systematically engineering the data needed to build a successful AI system.” [2]
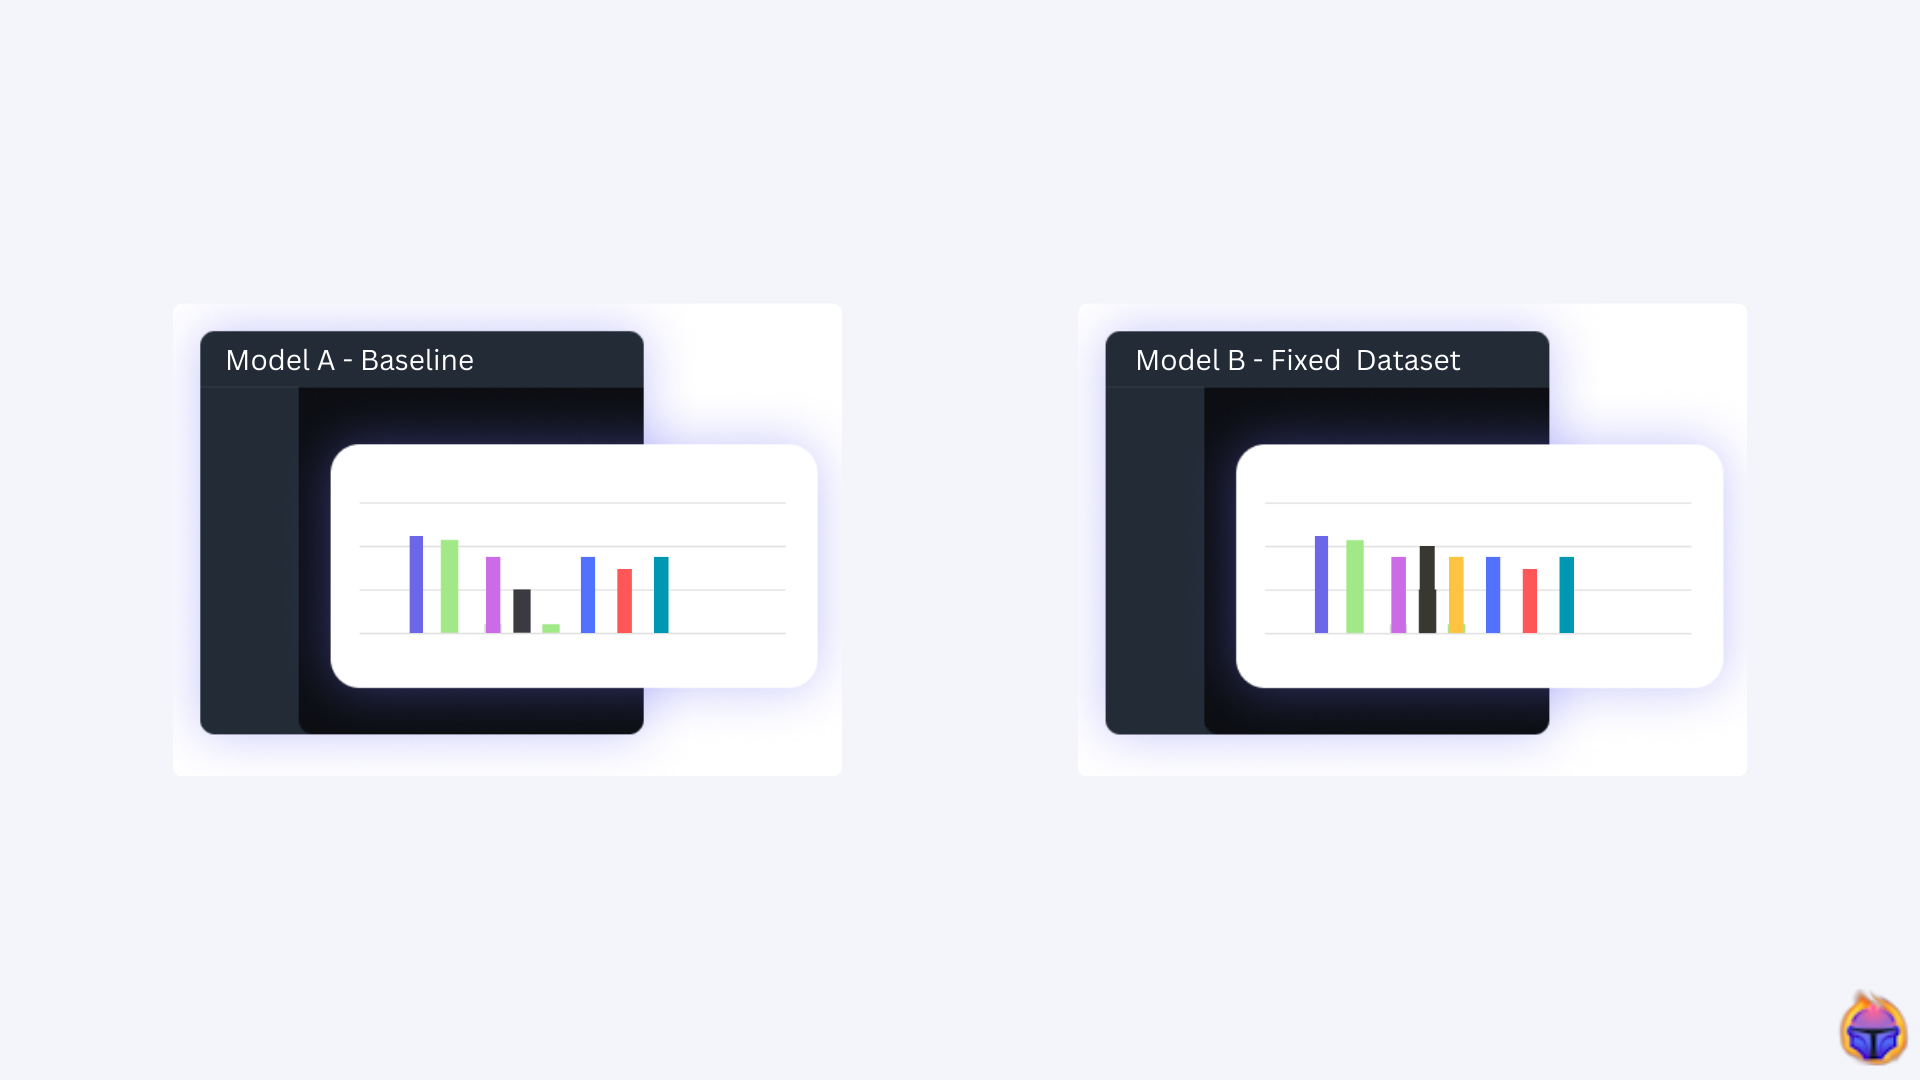
Hence, to understand our data, let’s first have a look at the Object Class Distribution in Figure 3.

- Annotations: The blue bars provide the per-class number of objects. Two of the three worst performing Classes (open hole and crack) have a relatively low number of objects, but the third, burr, actually has the largest number of annotations among all the Classes.
- Predictions (YOLO v8): The dark bars show the per-class number of objects the model is predicting. For all the underperforming Classes, the model is generating a decent number of predictions. However, it’s likely that many of these predictions fall into the False Positive category.
Focus on the most problematic class first: Burr Class
With this initial analysis of the problem, we will take a pragmatic approach and focus our efforts on improving performance where the model is failing the most.
Specifically, we will prioritize the burr Class, since that is where we have the most room for improvement compared to the best performing Classes like blow hole and open hole (see mAP for these classes on Figure 2).
The rationale is simple — by focusing on the worst performing Class first, we can potentially realize bigger performance gains than trying to optimize already well-performing Classes.
3. A thorough analysis of the Burr Class
With a plan in mind, we explore three concise ways to conduct an in depth data analysis of our failing Class: Figure 4 shows a sample where the burr Class is present.

The common yet effective measures: False Negatives & Mispredictions
We start with the basics, Figure 5 shows a multiclass confusion matrix. The way it works is the following. For False Negative predictions, the bottom row displays the total number of objects the model fails to detect. For Mispredictions, every intersection between a Ground Truth Class and a Prediction other than the expected Ground Truth Class is counted as a misprediction.

- False Negatives: We can see the burr Class has a total of 49 undetected objects! Voila, clearly our model has False Negative issue with this class. For reference, the best performing Class (blow hole) and second best (open hole) have only 7 and 1 undetected objects, respectively!
- Mispredictions: The burr Class doesn’t seem to have an incorrect prediction problem: the model is not confusing the burr Class with other Classes.
In summary, we quickly (with 1 click!) gathered the total number of undetected objects for the burr Class, compared it with other Classes, and discarded a misprediction problem.
🪄 Tip: For a refresher on metrics for object detection, we demystify some misconceptions around mean average precision (mAP) in this article.
Underneath the data: Exploring the Embedding Space
Now, let’s look at using another feature that can group our data through vector embeddings.
The Embedding Viewer is a tool that enables ML Engineers to view a dataset based on embeddings. It is ideal for searching clusters and edge cases in the data. In brief, it allows for exploring and visualizing high, mid, and low dimensional feature representations of objects in a dataset.
Figure 6. Embedding Viewer used to identify outliers and clusters of data
Figure 6 above illustrates the embedding space for our dataset. Based on this map, some of the salient insights we can come up with are:
- Most samples with undetected objects from the burr Class are grouped in the green color cluster. In contrast, correctly detected burr objects are shown in the blue color cluster.
- By creating “detected” and “undetected” tags around the burr Class, we can filter by these tags to gain a deeper understanding of this Class. For example, undetected objects can often be the result of a poor annotation process.
- We can compare a cluster from a well-performing Class (e.g. the orange group corresponding to the open hole Class) with a cluster from a poorly-performing Class (e.g. the green cluster): Do the images in the green group have lower resolution? Are the images in the orange group more accurately annotated?
Finding defects using embedding search: object, image and text
Now, for our final step, we enter the world of embedding search! As you may know, vector databases — a specialized type of database for storing and querying vector embeddings in Machine Learning — group similar data into clusters.
Hence, what if you could directly provide an object you are interested in (say a particular kind of defect, like a burr), and immediately find all the objects that are similar to the given one? 🤔
Well, this is possible with embedding search, and the Tenyks platform has a proprietary built-in search engine ready for you. Figure 7 shows how an undetected burr Class object is selected as input, and the search engine outputs similar undetected objects of the same Class! This feature also works for text and image queries.
Figure 7. Searching for similar defects using object-level embedding search
Of course, you could build your own embedding search engine, plan the optimal features, tinker with various vector database companies, source an embedding model, spin up some virtual machines, update and maintain each component, etc. However, an alternative is to have a state-of-the-art embedding search engine available within minutes after uploading your first dataset to the Tenyks platform.
It’s on us to help you ship models faster 🏁 by enabling rapid and effective debugging!
🎂 Bonus: At Tenyks you can construct automated workflows with the Tenyks API to fix the dataset failures you identified. A high-level workflow example might consist in combining some of the following ideas: i) sourcing the right kind of images (i.e. using Active Learning), ii) setting up automated identification of labeller mistakes, iii) identifying non-relevant data, or iv) firing up notifications to your team once certain biases in a data slice have emerged.
4. Next steps
We started by exploring our dataset, and the overall performance of the model.
In particular we analyzed the object class distribution. We selected one of the worst performing Classes, burr (0.35 mAP). Then, we argued for a Data-Centric approach: by fixing the burr Class, we have more room to increase model performance (faster) than by tweaking the model.
As we showed, there are several ways you can conduct data analysis at various levels, from exploring false negative samples to searching for similar defects at the object, image, or text level.
Now, the question is — will fixing the burr class really improve performance? The short answer is a resounding yes! Stay tuned for the long answer (i.e. how to do it) in future blog posts!
😀 Sneak peek: In tandem with our Roboflow friends, we actually showed in this article, how the Tenyks platform can improve performance for any model in the Roboflow Universe. This can provide you with a starting point to do it in on your own!
References
[1] Cast defects dataset (for Classification task)
[2] Why it’s time for data centric artificial intelligence
Authors: Jose Gabriel Islas Montero, Dmitry Kazhdan
If you would like to know more about Tenyks, sign up for a sandbox account.