
In Part 1 of this series, we highlight the 4 main issues you are likely to encounter in object detection datasets in agriculture.
We begin by summarizing the challenges of applying AI to crop monitoring and yield prediction. Then, we explore the top 4 issues practitioners face when working with agriculture datasets for object detection, including: objects being partially obscured; incorrect or inconsistent annotations; datasets that are not representative of real-world conditions; and images with different scales and resolutions.
Table of contents
- AI is transforming Agriculture — But challenges remain
- Top 4 issues in agriculture datasets for object detection
- Summary
1. AI is transforming Agriculture — But challenges remain
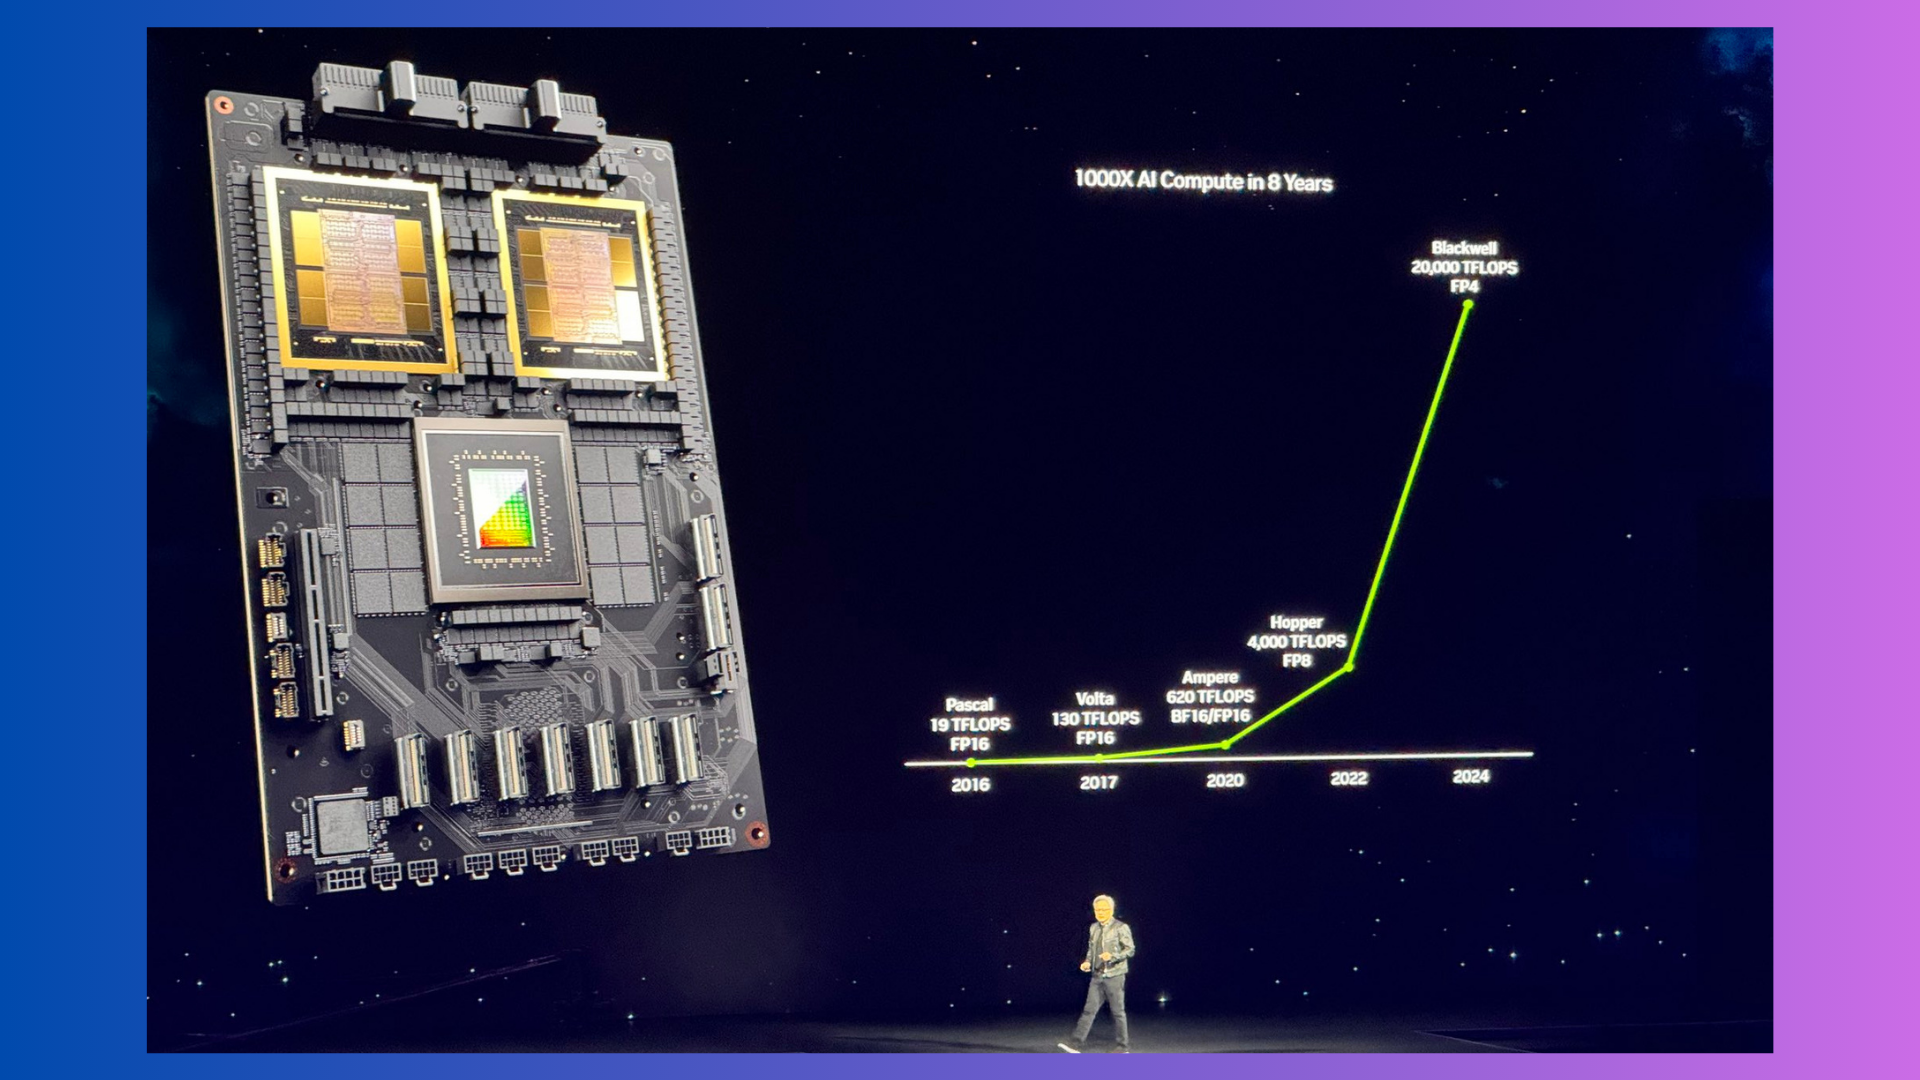
AI is enabling more proactive and data-driven decision making in agriculture for tasks like crop monitoring and yield prediction.
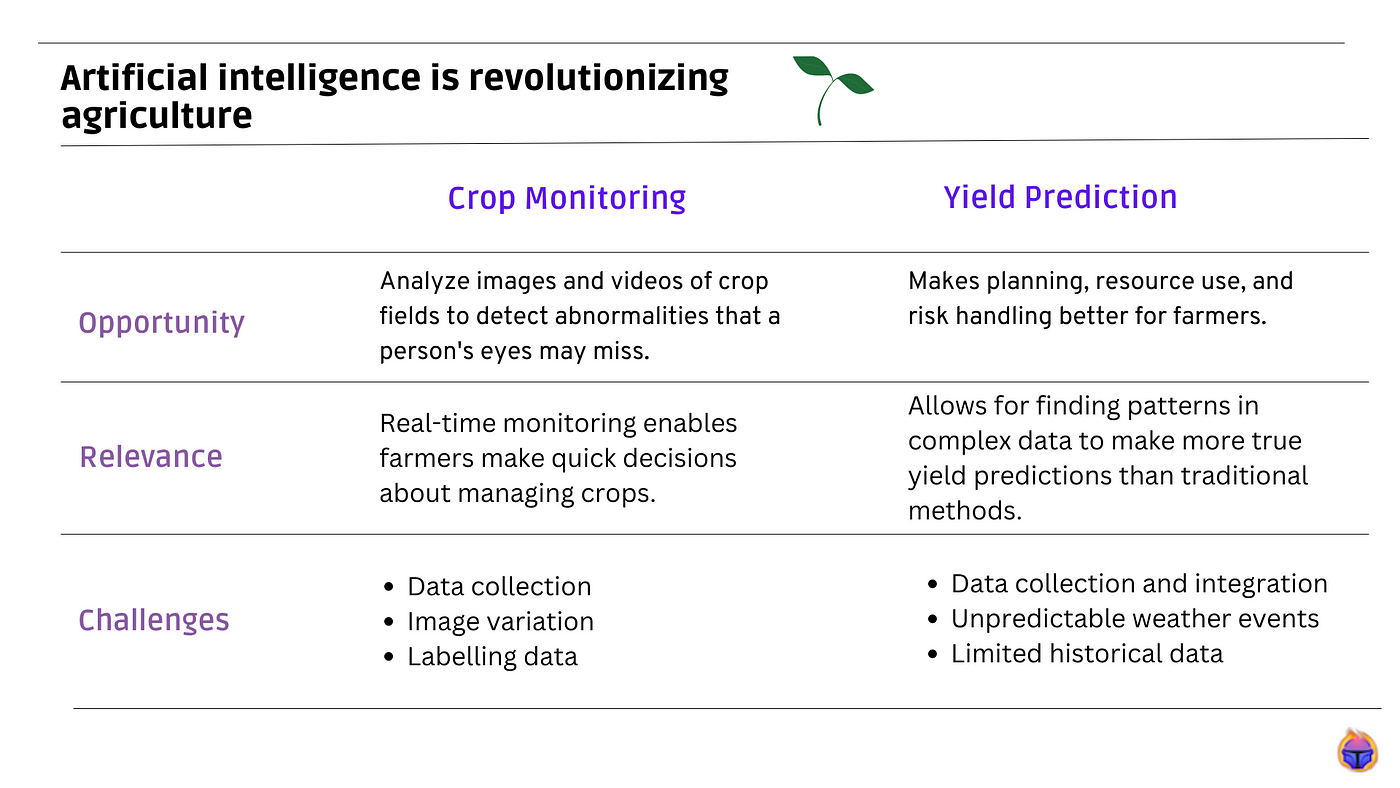
Crop Monitoring
Using machine learning algorithms, AI systems can analyze images and videos of crop fields to detect abnormalities, pest infestations, and damages. This allows farmers to intervene early and take corrective actions.
Opportunity: Allows for early detection of issues that human eyes may miss. Can monitor large fields that are difficult for farmers to inspect physically.
Importance of AI: AI systems can analyze imagery at a speed and scale that is not possible for humans. This near real-time monitoring helps farmers make timely management decisions.
Challenges:
- Data collection: Gathering a large and diverse dataset of high-resolution crop images is challenging. Factors like different times of day or weather conditions can impact image quality.
- Image variation: Images of the same crop can vary significantly based on lighting, camera angle, crop growth stage, which increases model complexity.
- Labelling data: Accurately labelling issues and abnormalities in crop images require expertise and time from agronomists and farmers, a process that can be expensive and slow.
Yield Prediction
AI algorithms use factors like soil data, weather data, imagery data to predict the yield of a crop for a given field. This allows farmers to plan resource allocation and sales in advance.
Opportunity: Improves planning, resource optimization and risk management for farmers. Can lead to higher and more stable crop yields.
Importance of AI: AI techniques can find patterns in complex data to make more accurate yield forecasts than traditional statistical methods. This helps optimize crop management strategies.
Challenges:
- Data collection and integration: Obtaining accurate data from different sources like soil sensors, weather stations and crop imagery is a challenge. Data may be in inconsistent formats.
- Environmental factors: Unpredictable weather events and pest/disease outbreaks can significantly impact yield and are difficult to account for in models.
- Limited historical data: For new crop varieties or fields, limited historical yield data is available for building accurate prediction models.
2. Top 4 issues in agriculture datasets for object detection
2.1 Our goal
We aim to show the top 4 most common issues ML engineers and other practitioners encounter when dealing with object detection datasets in agriculture. These problems include:
- Occlusion
- Label quality
- Data imbalance
- Scale variation
To accomplish this goal, we set a task to detect apples using object detection. We fine-tuned a YOLO v8 model with a real industry-level dataset comprising two classes: red and green apples. In the rest of the article, we will refer to this dataset as the Apples Dataset.
🎩 Looking for fine-tuning a custom dataset in YOLO v8? Check our article on “top 5 tips to solve performance bottlenecks in fruit-counting” where we share a colab notebook with a training set up to accomplish this task.

2.2 Occlusion
This problem arises when objects are occluded or blocked from the camera’s view by other objects in the scene.
Occluded objects are common in agricultural images due to the dense nature of fields and orchards. Parts of the objects may be hidden, only parts may visible, or the objects may be completely behind other foreground objects.
In our use-case, since fruits tend to sprout near each other in dense numbers, they frequently block each other from full visibility.
Heavily occluded objects in agriculture datasets can result in the following consequences:
- Models trained on datasets with imbalanced occurrences of occluded and non-occluded objects will become biased towards the more frequent of these two scenarios.
- Occlusion can introduce errors like misclassifications and missed detections.
- It can be hard to generate synthetic heavy occlusion examples through data augmentation that reflect real-world occlusion conditions in agriculture.
Exploring occlusions. To identify occluded samples we can a) inspect our data to find occlusions manually or b) find them automatically by looking at the bounding box overlap. In the latter case we can rely on the Tenyks platform to automatically identify several examples presenting occlusion.
As shown below, we can quickly visualize the dataset, turn on/off the ground truth labels as well as the predictions, and simply start exploring the degree of occlusion in our data.
Figure 2. In search of occluded objects using the Tenyks platform
Some of the insights we obtained from the occluded samples are:
- Annotations for occluded apples are inconsistent. Some samples contain annotations for partially visible apples, but others don’t.
- Apples are occluded by: a) other apples, b) leaves, c) branches. Incorporating a set of -balanced- well-annotated occluded objects as part of the training set may help the model generalize better. 🔥 More on Part 2 of this series.
- Apples obscured by shadows are imbalanced. Our dataset seems to have a lack of lighting variety: few images contain shadows cast by leaves or branches that can partially obscure some of the apples.
2.3 Label quality
Poor quality labels can be a major issue in object detection datasets for agriculture:
- Mislabeled samples introduce incorrect ground truth labels, which can result in incorrect predictions by the object detection model.
- The incorrect labels impact the calculation of precision and recall for each class.
- If mislabeled samples are incorrectly labeled as positive instances, they can artificially inflate the number of true positives and potentially increase precision for that class.
- Conversely, if mislabeled samples are incorrectly labeled as negative instances, they can artificially decrease the number of true positives, leading to lower precision for that class.
- These incorrect labels affect the calculation of average precision, which is the mean of precision values across all classes, ultimately impacting the overall mAP.
Exploring annotations. As we stated earlier, manually inspecting our data in sequence or even randomly, with no strategy in place, is not the most efficient way to conduct this step.
An alternative approach can be:
- i) select the worst performing class
- ii) discard low-confidence predictions below a chosen threshold
- iii) discard missing predictions
- iv) explore the samples
With the help of the Tenyks platform we can conduct strategies similar to the one above: we can filter out our samples by several criteria with a couple of clicks.
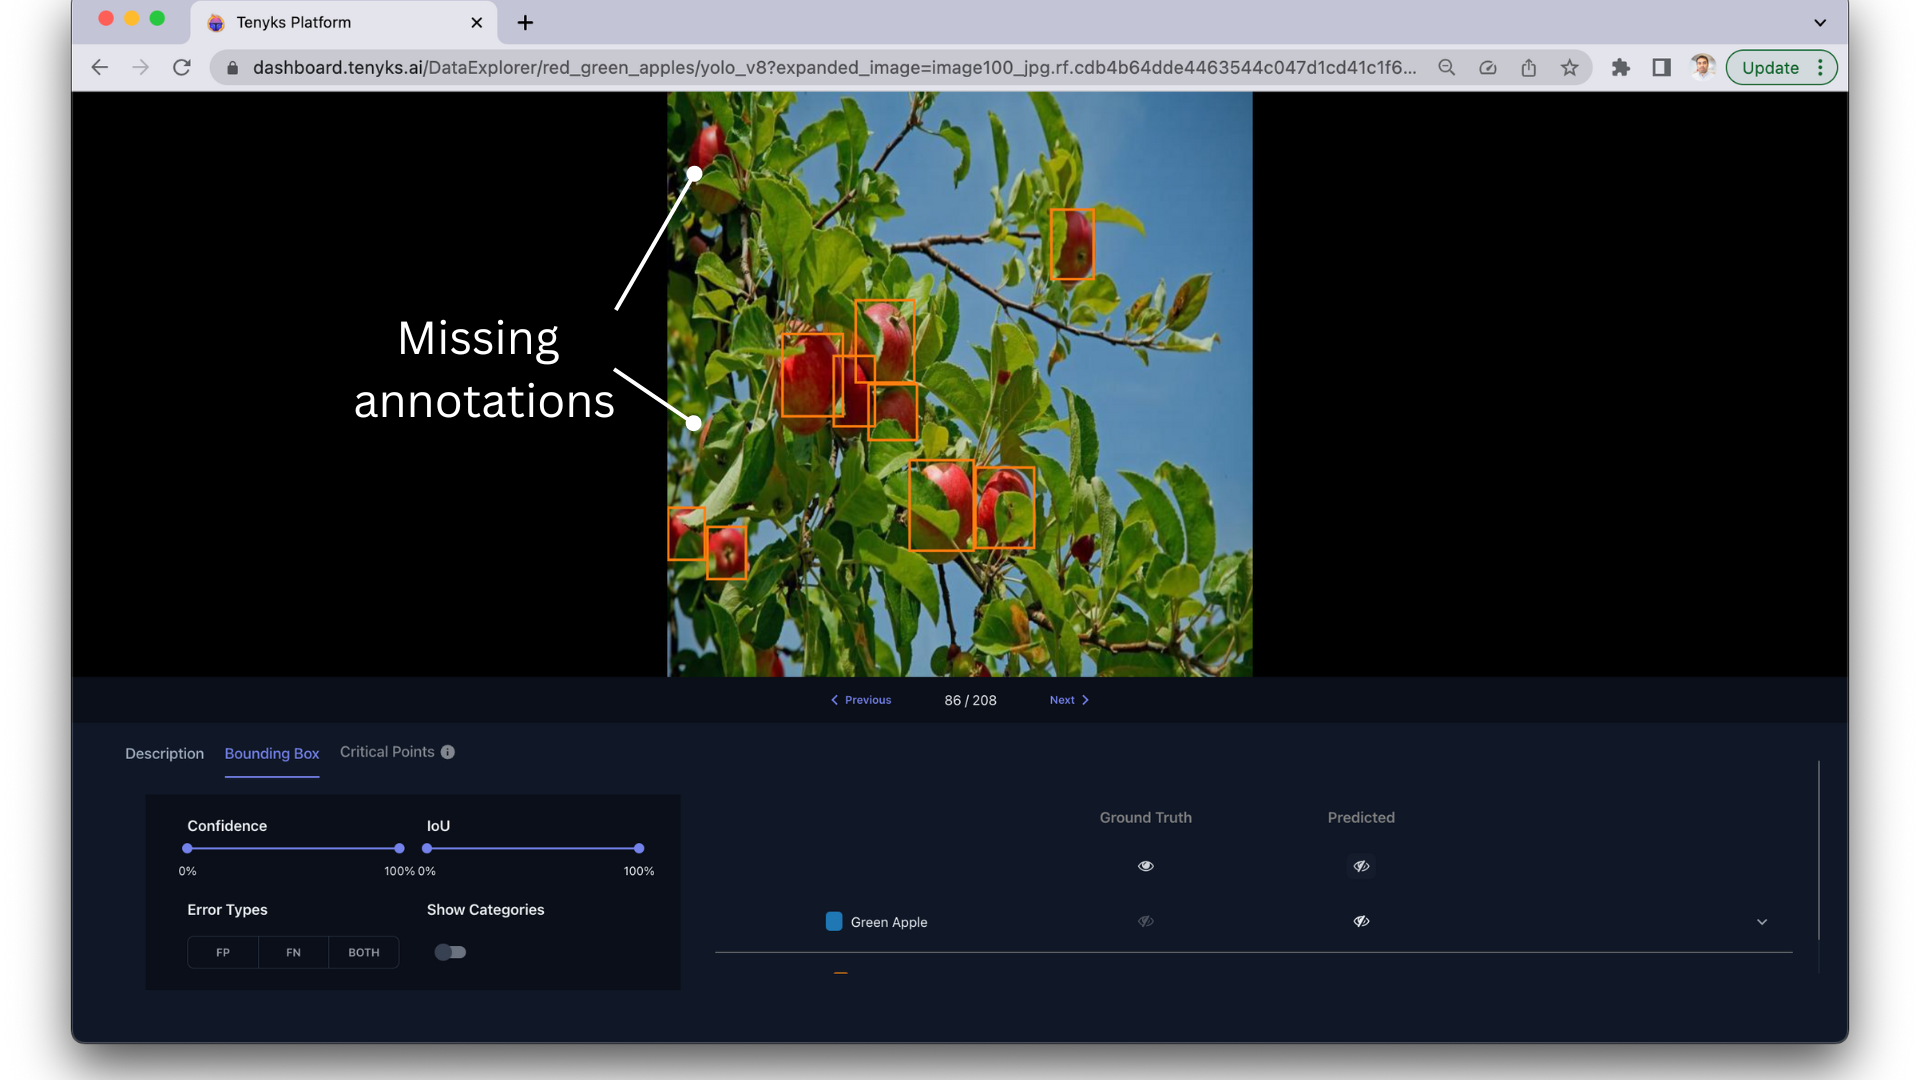
Figure 3 shows how easy it is to select all the samples belonging to the class Green Apple, while turning on the ground truth annotations to start exploring our dataset.
Figure 3. With the Tenyks platform we can filter out samples by class and explore our dataset right away
- a) Missing annotations. Some objects in the training images may be missed and not annotated at all. This can cause the model to fail to detect those types of objects. One naive but straightforward approach is to identify high confidence yet incorrect predictions (false positives) for instances where we lack annotation data.
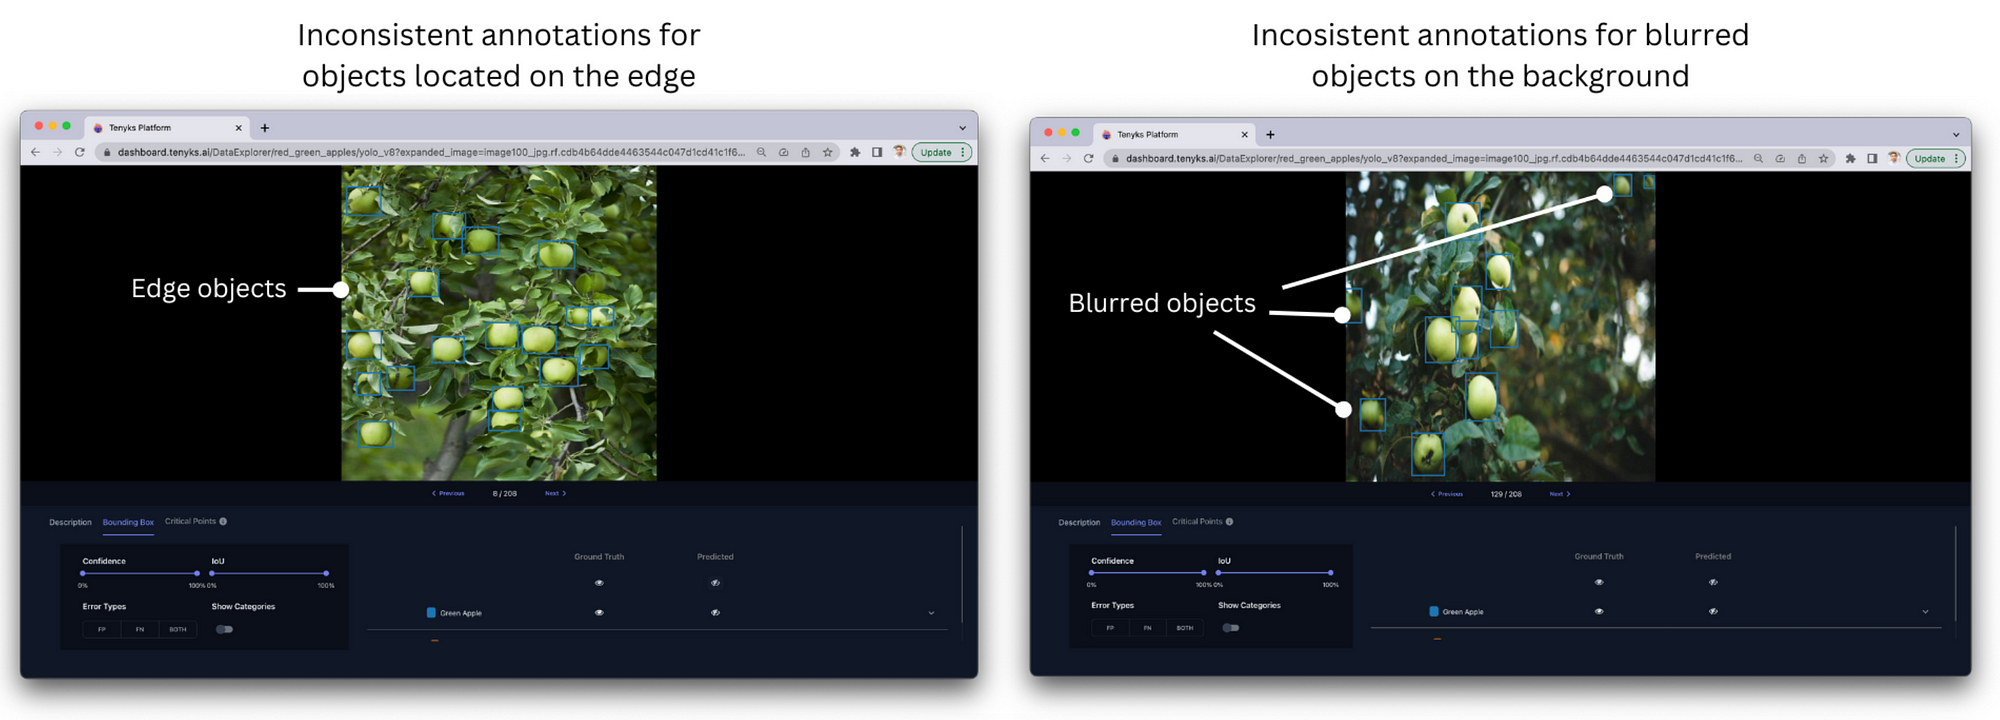
- b) Inconsistent annotations. Different labelers may annotate objects inconsistently. This makes the training data noisier and harder for the model to learn from. The Apples Dataset contains inconsistent annotations in at least two cases: a) apples located on the edge of the image, and b) blurred apples (i.e. far from the camera). In both cases sometimes they are annotated, but other times they aren’t.
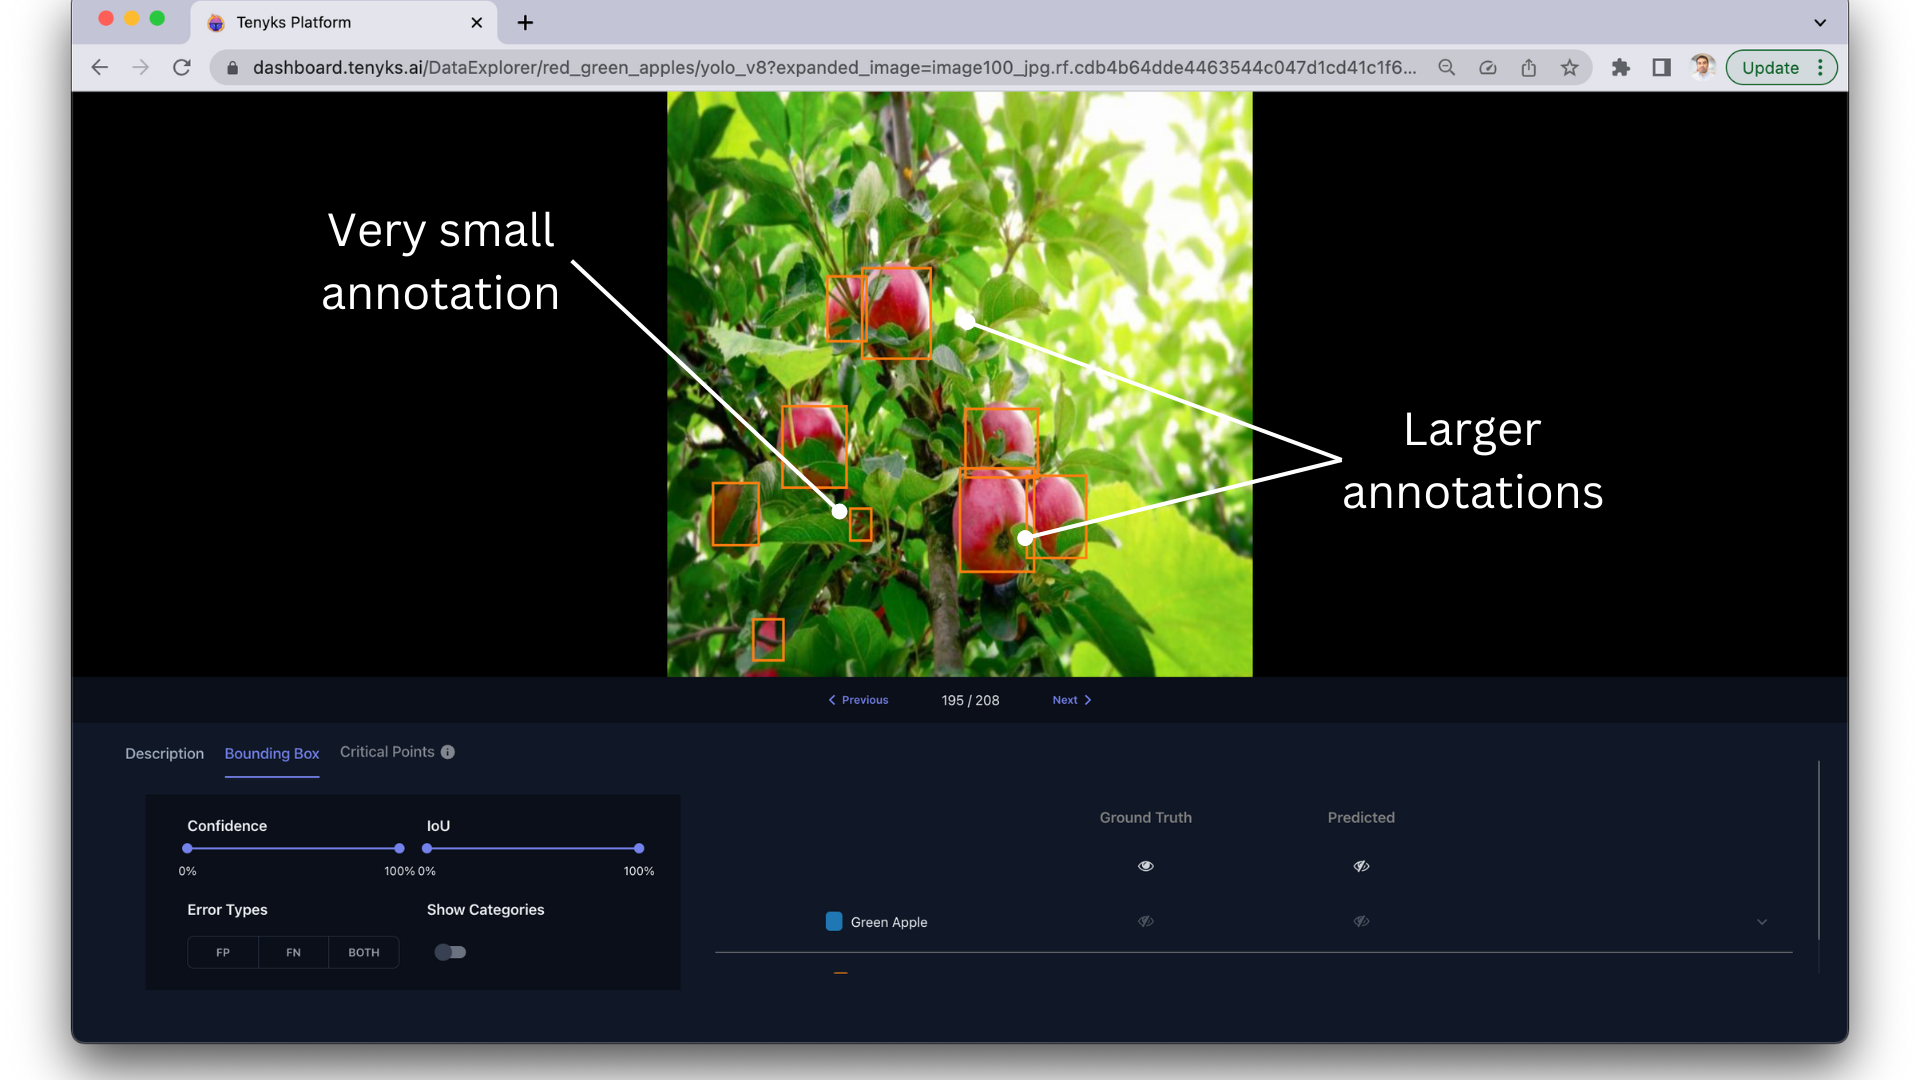
- c) Variability in size of annotated bounding boxes. In agriculture related datasets, different size of annotations makes it hard for models to learn object sizes. Models have trouble knowing the usual shape and size of objects. This causes lower accuracy and limits how well models can be used in new situations. We dig deeper into a similar and relevant issue in section 2.4 Scale Variation.
2.4 Data Imbalance
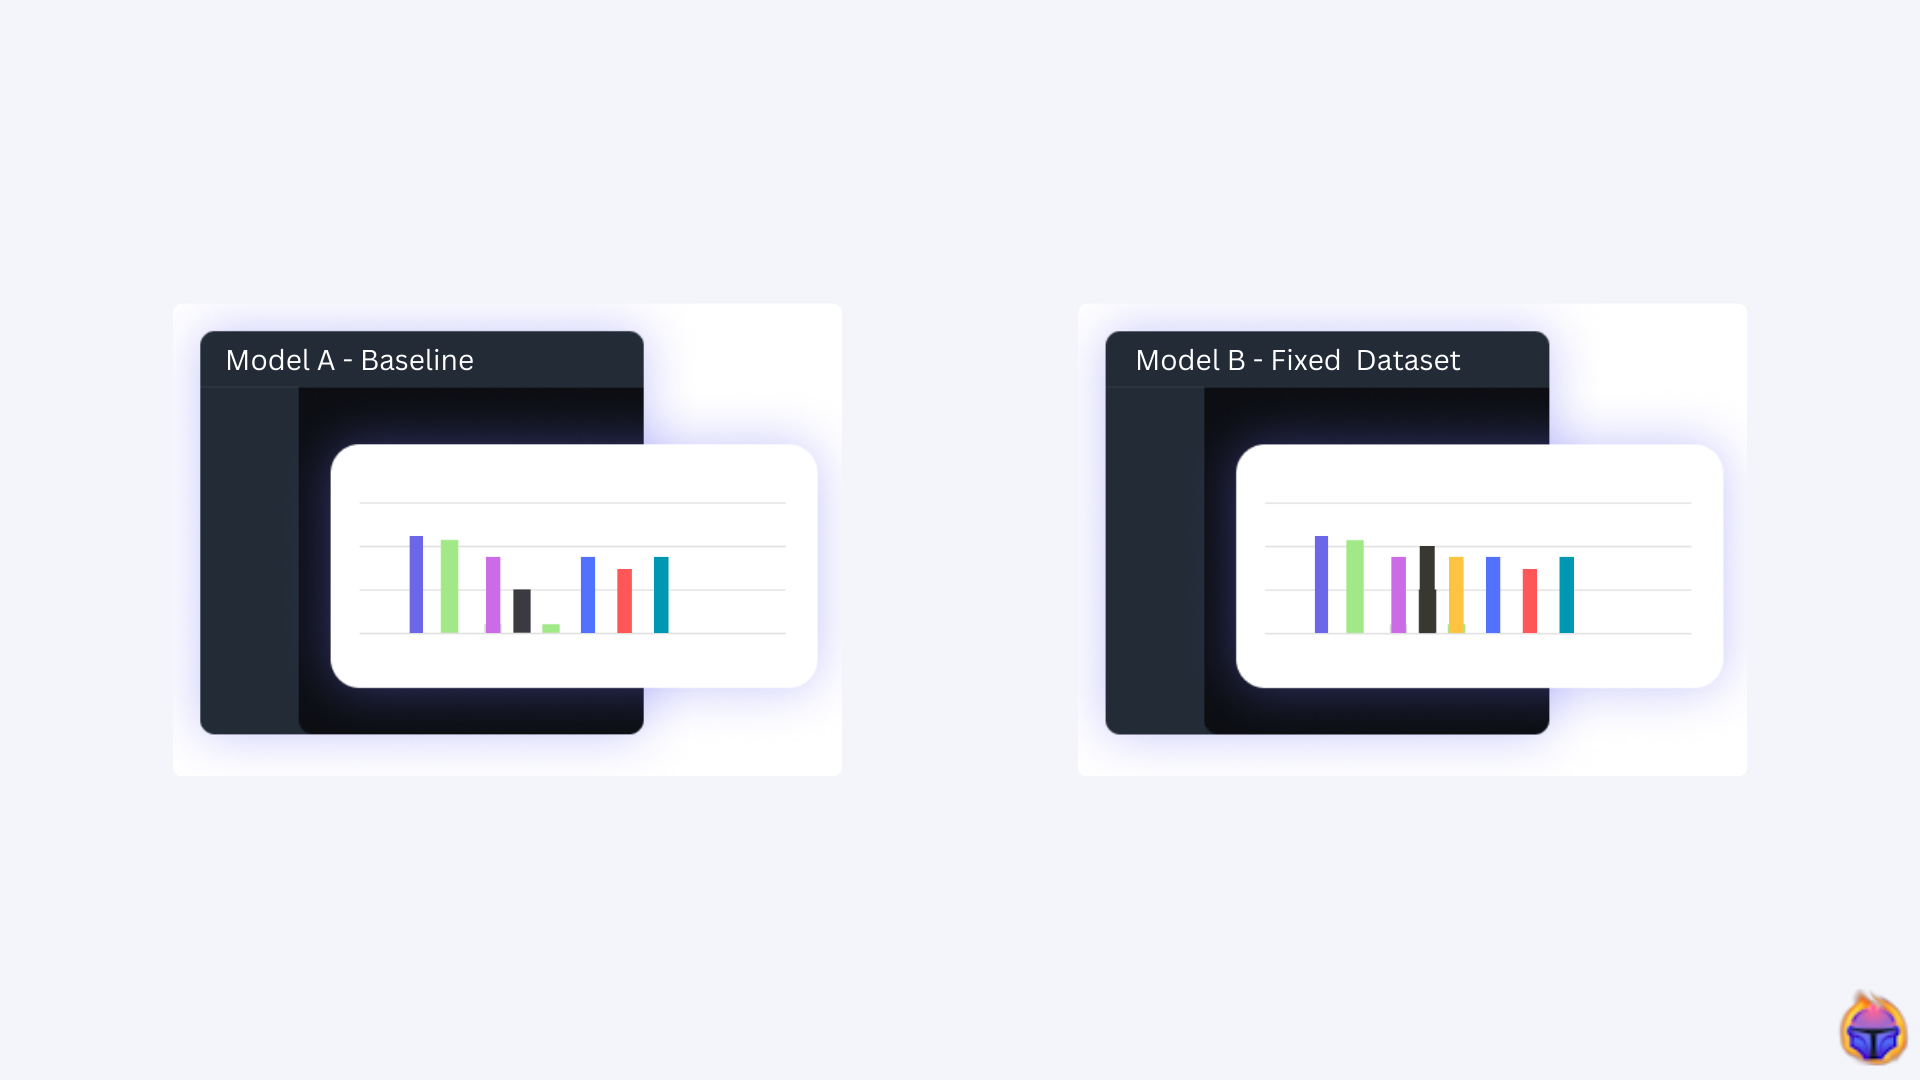
To enable powerful and reliable AI systems for agriculture applications, we need datasets that accurately reflect the actual data balance and complexity of real-world agricultural systems.
Here are some consequences of data imbalance in agriculture datasets for object detection:
- Narrow applicability range. If datasets only contain images from a narrow geographical region or seasonal period, the models trained on that data will only be effective within that limited environmental range.
- Reduced robustness. Given that edge cases and uncommon scenarios are underrepresented in datasets with limited diversity, models struggle to properly detect and handle these cases during deployment.
- Low reliability. Models trained on imbalanced datasets can become biased towards the most prevalent or overrepresented classes, conditions and scenarios in the dataset.
Exploring data imbalance issues. Finding these issues in a dataset can be harder than simply discarding high or low confidence samples in search of data issues: human data-inspectors can become fatigued and less careful over time.
Rather than a) exploring data randomnly or b) investing time/money in coding a solution from scratch, we can use embedding analysis to find outliers, or under-represented points.
Figure 7 shows an example of embedding analysis in the Tenyks platform. The embedding viewer can help us to quickly group our samples by high-level and low-level features.
Figure 7. The embedding viewer helps us find edge cases when we cluster by low-level features
From there we can easily spot samples that share similar characteristics, and also edge samples that seem unrelated to the rest of the dataset.
For the Apples Dataset, these are the relevant issues we found:
- Varied weather and lighting conditions: The dataset is imbalanced with respect to low-light or shaded apples.
- Limited color variability: There are only red and green apples on this dataset. How the model will perform if the farmer decides to add yellow apples?
- Limited apple variety: Only categorical Red or Green apples are included (and labeled) in the dataset. Other common apple varieties like ‘Granny Smith’, ‘Fuji’, etc. are not present.
- Camera viewpoints: Most images display zoomed-in side and front views densely populated by apples; other angles where the whole apple tree is displayed as well as zoomed-out views are missing.
- More diverse orchard backgrounds: Very few images contain a background where other orchards are displayed.
- Number of apples per image: The number of apples per image, in most of the samples, is roughly the same (i.e. 10 apples).
2.5 Scale variation
In general, objects in agriculture datasets for object detection appear at a wide range of sizes caused by:
- Different distances from the camera
- Different actual object sizes
- Different image resolutions
What does this imply? This scale variation means the same object (e.g. a tomato plant) could appear from 50 pixels wide to 1000 pixels wide in different images.
Exploring the variance in scale of apples. Datasets need to capture objects at a range of scales to properly train detectors.
A potential way to account for scale variance is to search for outliers by analayzing the metadata associated with the images and the annotations (e.g. the bounding box size in the standard object detection format).
Another way to identify outliers in scale variance is to group or cluster our samples by low or high-level features. The Tenyks platform has a built-in functionality to group our samples by high-level features and other criteria.
This clustering speeds up identifying samples containing entire apple trees, where the size of the apples is minuscule when compared to zoomed-in examples where one single apple can take between 10% and 20% of the area in an image.
Figure 8. Grouping by high-level features allows us to identify common issues faster
A third way to identify outliers is by running data quality checks (DCQ), which are procedures used to identify and correct errors and issues in data. They ensure the data meets certain standards for accuracy, consistency, and completeness.
We use the Tenyks platform DQC Scale detector to find samples with scale variation as shown below.
Figure 9. Tenyks DQC Scale detector in action
Some of the highlights we found are:
- Most apples trees on the dataset appear at different distances from the camera in the images, resulting in different scales.
- In general, the images have low-res images used for “scouting” the orchard to high-res images for detailed inspection of the apples. This maps the same physical tree to different pixel sizes.
- Many images contain tiny apples on the background that are poorly annotated: there seems to be no consistency or rule of when to annotate or not a tiny object.
3. Summary
In this article, we examined some of the challenges and opportunities in applying AI in agriculture. In particular, we highlighted two applications where AI is transforming agriculture: crop monitoring and yield prediction.
We used the Tenyks platform to identify, in a very organized and efficient way, every issue we mentioned earlier: occlusion, label quality, data imbalance and scale variation. We showed how quickly we can start analyzing a dataset, toggle ground truth annotations and predictions on and off. We leveraged features of the platform like the embedding viewer to help us find rare samples considerably faster than if we had manually reviewed every instance.
In Part 2 of this series, we will discuss how we can solve each of the 4 problems addressed in this article. We will examine methods to:
- Improve annotation quality
- Address data imbalance
- Handle scale variations
- Handle occlusion
By tackling these issues head on, we can make the most of AI’s potential to transform farming practices and boost agricultural productivity.
Stay tuned for Part 2!
Update: Part 2 is available here!
Authors: Jose Gabriel Islas Montero, Dmitry Kazhdan
If you would like to know more about Tenyks, sign up for a sandbox account.