
Sports analytics leverages computer vision techniques to extract meaningful insights from sports data.
In this article, we demonstrate this using a football soccer dataset in object detection. We take a data-centric approach to identify areas where the model struggles, such as problematic classes as well as common failures such as data imbalance and label quality.
Table of Contents
- Sports Analytics: What is it?
- A football soccer dataset
- Where is the model being challenged?
- Analyzing the Ball Class
- Next steps
1. Sports Analytics: What is it?
Sports analytics in computer vision [1] leverages computer vision techniques to extract meaningful data and insights from sports video and imagery. It typically involves using algorithms like object detection and tracking to identify and follow elements like players, balls, paddles, etc within the footage (Figure 1).
Figure 1. Object detection used to detect players during a match
How does it work at a high-level?
- The computer vision models (e.g. YOLO) can detect the locations of these objects in each frame and track their motions over time.
- This allows for the automated collection of spatial data like player and ball positions, distances covered, and object trajectories.
- Further analysis can then quantify things like possession time, pass accuracy, shot velocity, movement patterns and more
2. A football soccer dataset
For this article we will use a dataset of a football soccer match (Figure 2).
- Model: Pre-trained YOLO v8, fine-tuned with this dataset.
- Inference: Performed on this video.
- Classes: Player, Referee, Goalkeeper, Ball.
Figure 2. Our object detection dataset: a soccer match.
In sports analytics, object detection can be applied to a football soccer match in some of the following ways:
- Player Detection — Detect and track all players on the pitch using bounding boxes around each player in every frame. This allows analysis of things like positioning, formation, and physical demands.
- Ball Tracking — Detect and follow the ball throughout the match. This enables metrics like pass accuracy, shot velocity, possession time, and ball trajectory after shots, passes, clearances etc.
- Event Detection — Detect key events like shots, tackles, fouls based on player motions and proximity. This automates highlight generation and identification of important moments.
3. Where is the model being challenged?
Exploring model performance and the object Class distribution
First, to understand where the model might be failing, we first check the per-class performance of the model. As shown in Figure 3, the Ball Class has the lowest performance: the model barely detects this object Class.
- An mAP of zero for the Ball Class can mean two things: a) It suggests that the class was either completely missed (false negatives) or b) all detections were incorrect (false positives).

Second, we analyze the per-class object distribution in our data. Figure 4 illustrates that the Ball Class has 273 annotated objects, however objects of this class are not being predicted, see Figure 3.
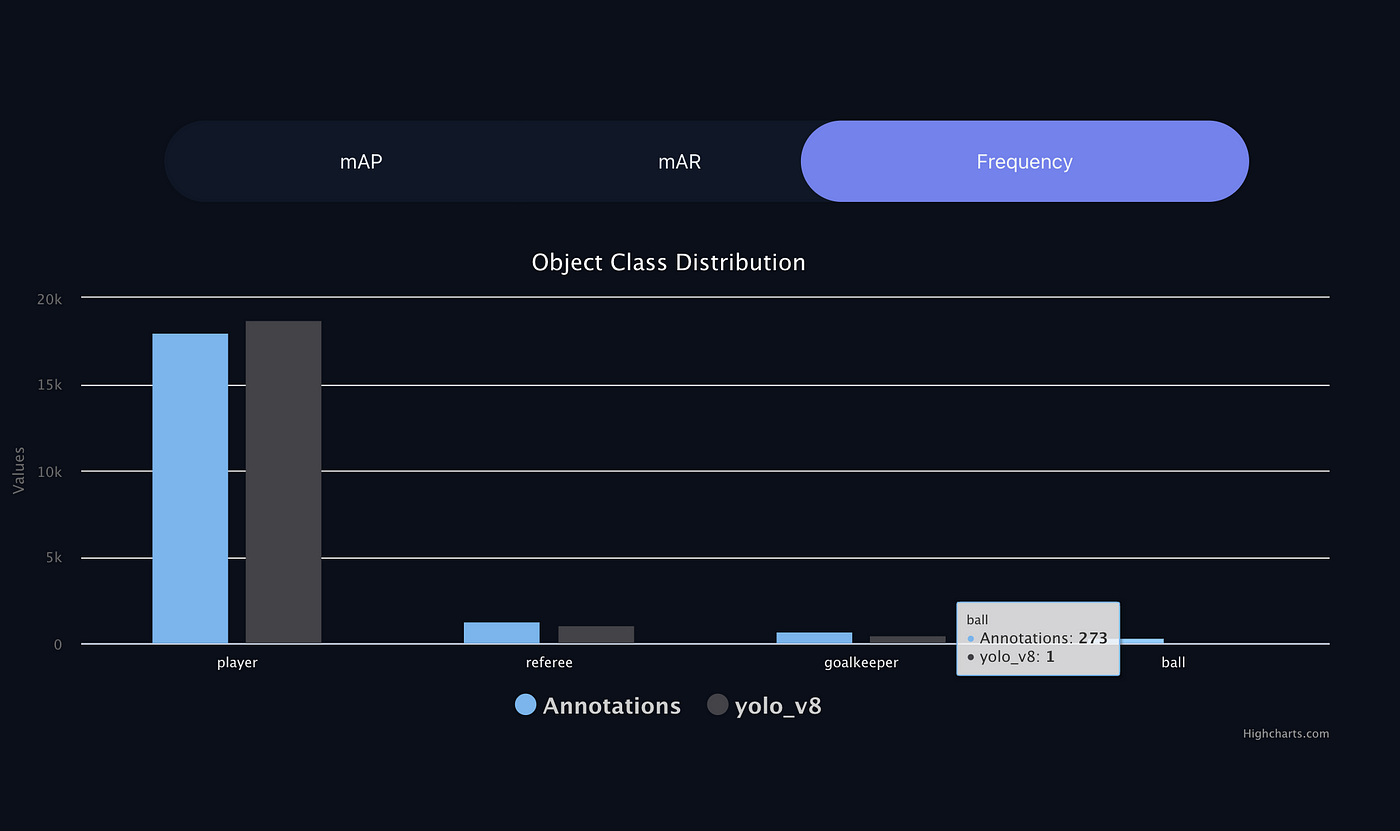
In summary, with this basic but principled analysis we found:
- i) The low hanging fruit to improve model performance is on the Ball Class.
- ii) We are dealing with data imbalance.
- iii) Only the Player Class is performing well.
4. Analyzing the Ball Class
Why conducting a Data-Centric approach?
Finding out why the model is failing at detecting the Ball Class could involve examining the data, model architecture, hyperparameters, and other aspects of the YOLO model to identify and address the issues specific to that class.
However, a data-centric [2] approach centers high-quality training data as the foundation of building relianle machine learning systems. Without accurate, clean, and representative data, even the most advanced model architectures may struggle to perform well.
Big Picture: False Negative (FN), False Positive ( FP) and True Positive (TP) predictions

From Figure 5 we can quickly see that out of 270 samples of the Ball Class, the majority of them (~220) are mispredictions, and 40 are undetected objects. Hence, we can conclude that the Ball Class has both a misprediction issue and a non-detection problem (False Negatives).
Mispredictions and False Negatives: Finding the root cause
Figure 6 shows how we can conduct an in-depth analysis for the Ball Class in the Tenyks platform. We select the as Ground Truth the Ball Class, and we filter by error:
We can quickly discover that the dataset has severe annotation problems for the Ball Class. Every single frame shown in Figure 6 shows an annotation for an object that does not correspond to a Ball Class.
Figure 6. Using Tenyk’s built-in error filters to find why performance on the Ball Class is low
The Data Explorer, in the Tenyks platform, helped us identify in a short amount of time why the model is mispredicting and undetecting the Ball Class. All this functionality is available in your free Tenyks sandbox account.
In summary,
- i) We identified the Ball Class suffers from False Negative and Misprediction issues.
- ii) We tracked down the root cause (Label Quality) of these issues thanks to the Error Filters in the Data Explorer of the Tenyks platform.
🔑 Note: This is only one way to identify label quality issues, but there are other methods, the Tenyks platform has built-in multi-modal embedding search at the object level to select one problematic example. Then, find other similar examples in your data. This approach works even if you have a very large dataset, say 100M+ images. Similarly, once the failures have been identified, there are many ways to fix the issues (e.g., quickly, cheaply and automatically) mostly depending on your budget.
5. Next steps
In this article we conducted a data-centric approach to assess a sports analytics computer vision model.
In particular, we found data imbalance issues and label quality issues. Using the built-in tools of the Tenyks platform, we were able to spot these issues, and to uncover the cause behind the low performance in the Ball Class.
⭐️ Bonus: Another way to spot dataset errors is by using Tenyks embedding search engine. Given an image, text or an object, the Tenyks platform embedding search feature, allows you to explore your dataset in unique ways.
Figure 7. Embedding Search on the Tenyks platform
For instance, in Figure 7, we can observe the following:
- i) After selecting an object that shows a player with the number 20 on his t-shirt, the system quickly retrieves other similar objects from the dataset: all of them show the same player with the number 20.
- ii) Typing “penalty” on the search bar retrieves all the images where a penalty scene takes place.
😀 Interested in more about data-centric for Computer Vision? Check our article Where is my Model Failing?.
References
[1] A Comprehensive Review of Computer Vision in Sports: Open Issues,
Future Trends and Research Directions.
[2] Why it’s time for data centric artificial intelligence.
Authors: Jose Gabriel Islas Montero, Dmitry Kazhdan.
If you would like to know more about Tenyks, sign up for a sandbox account.